Company Logo

Procurement Resource

kuni****@gmail.com
WEFRU0444240806202
Scan to visit website

Scan QR code to visit our website

Blog by Procurement Resource | Digital Diary

" To Present local Business identity in front of global market"

Meri Kalam Se
Digital Diary Submit Post Procurement Resource

Carbon Credit Price Trend October 2026: China vs Korea

Carbon Credit Price Trend October 2026: China vs Korea
Carbon Credit Price Trend: China’s Market Pulls Ahead of South Korea in October 2026 Carbon markets don’t usually make headlines the way oil or metals do, but the numbers coming out of October 2026 deserve a closer look. China’s carbon credit is trading at USD 9.53 per tCO2e on an FOB basis. South Korea’s sits at USD 7.00 per tCO2e, also FOB. Same unit, same incoterm, and still a gap of USD 2.53 b... Read More
Carbon Credit Price Trend: China’s Market Pulls Ahead of South Korea in October 2026 Carbon markets don’t usually make headlines the way oil or metals do, but the numbers coming out of October 2026 deserve a closer look. China’s carbon credit is trading at USD 9.53 per tCO2e on an FOB basis. South Korea’s sits at USD 7.00 per tCO2e, also FOB. Same unit, same incoterm, and still a gap of USD 2.53 between the two. That’s not a rounding error. On a market where credits trade in bulk volumes, a 36% price difference between two major Asian carbon schemes tells you something about how differently these systems are built and run. Carbon Credit Latest Prices October 2026 Carbon Credit – China: USD 9.53/tCO2e (FOB)Carbon Credit – South Korea: USD 7.00/tCO2e (FOB) Price Source: Procurement Resource Both figures reflect the same month, so there’s no seasonal distortion muddying the comparison. What you’re looking at is a straight snapshot of two carbon pricing mechanisms operating at different stages of maturity, with different supply-demand balances behind them. Why China’s Carbon Credits Cost More Right Now China runs the largest emissions trading scheme by volume in the world. That scale matters. More participants, more sectors under compliance obligations, and a tighter squeeze on allowances as the government pushes power generators and heavy industry toward stricter caps. Demand has been building steadily. Chinese authorities have been expanding coverage of the national ETS beyond power generation into steel, cement, and aluminum. Every sector added means more buyers competing for the same pool of credits, and that competition shows up directly in price. There’s also a policy angle worth mentioning. Beijing has signaled tighter allocation going forward, meaning fewer free allowances handed out and more credits that need to be purchased on the open market. Tighter supply, steady demand. Prices respond accordingly. Why South Korea’s Market Looks Different South Korea’s K-ETS has been around longer than China’s national scheme, but it’s smaller in scope and has dealt with a persistent oversupply problem for years. Allocation has historically run generous, which keeps a lid on prices even when industrial emitters would otherwise be willing to pay more. Economic conditions in South Korea’s manufacturing sector have also softened demand somewhat. When industrial output slows, emissions drop, and so does the need to buy additional allowances. That’s part of what’s keeping the South Korean price anchored below the USD 8 mark while China pushes past USD 9. Frankly, this isn’t a new pattern. South Korea’s carbon price has lagged behind China’s for a while now, and October’s numbers are consistent with that trend rather than a sudden shift. What’s Actually Driving the Spread A few forces explain most of the USD 2.53 gap between these two markets: Scheme design plays the biggest role. China’s cap is tightening faster than South Korea’s, and tighter caps push prices up almost mechanically. Sector coverage matters too. China is actively bringing more heavy industry into its compliance net, which widens the buyer pool. South Korea’s coverage has stayed comparatively static. Market liquidity is another factor people tend to overlook. China’s ETS, despite being younger, now moves far larger volumes than South Korea’s, and higher liquidity tends to produce prices that reflect genuine scarcity rather than thin trading noise. Currency and macro conditions matter at the margins too, though less than scheme fundamentals. Both prices are quoted in dollars, so local currency swings don’t distort the comparison much here, but broader industrial demand in each economy still feeds back into how many allowances companies actually need. What This Means for Buyers, Traders, and Corporate Advisers If you’re advising a client with carbon exposure in either market, the takeaway isn’t complicated: these aren’t interchangeable credits. A company offsetting obligations under China’s ETS can’t simply shop for cheaper South Korean allowances instead. Each scheme is closed to its own jurisdiction, so the price gap reflects two separate, non-fungible markets rather than one arbitrage opportunity. For finance teams forecasting compliance costs, China’s trajectory is the one to watch more closely. If Beijing keeps tightening allocation and expanding sector coverage the way it has signaled, USD 9.53 may not be the ceiling. South Korea’s price, by contrast, looks more likely to stay range-bound unless policymakers overhaul the allocation formula that’s kept allowances loose for years. For readers tracking broader commodity and compliance markets alongside carbon, Procurement Resource’s Carbon Credit Price Trends report breaks down historical pricing patterns and regional policy shifts in more detail. Where This Leaves the Carbon Credit Price Trend October 2026 confirms what’s been building for a while: China and South Korea are running two very different carbon pricing stories under the same commodity label. China’s tighter caps and expanding compliance net are pushing its credit price upward, while South Korea’s looser allocation keeps its market comparatively subdued. Anyone pricing carbon exposure across both jurisdictions needs to treat them as distinct markets, not variations on the same theme.
Read Full Blog
kuni****@gmail.com 19 Nov 2026 13 Views

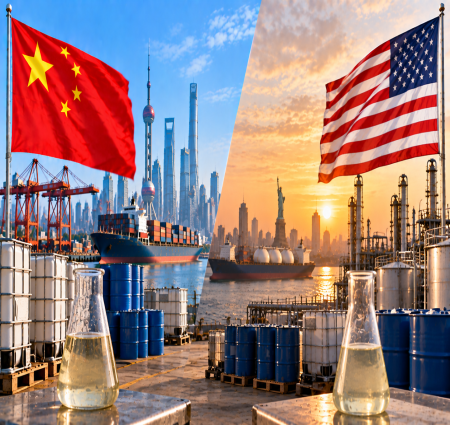
Phosphoric Acid Price Trend October 2026 | China vs USA

Phosphoric Acid Price Trend October 2026 | China vs USA
Phosphoric acid doesn’t usually make headlines. It sits quietly behind fertilizers, detergents, animal feed, and a handful of industrial processes most people never think about. But in October 2026, the price gap between China and the United States got wide enough that it’s worth stopping and asking why. China’s phosphoric acid is priced at USD 1,250.26 per metric ton on an FOB basis. The USA, mea... Read More
Phosphoric acid doesn’t usually make headlines. It sits quietly behind fertilizers, detergents, animal feed, and a handful of industrial processes most people never think about. But in October 2026, the price gap between China and the United States got wide enough that it’s worth stopping and asking why. China’s phosphoric acid is priced at USD 1,250.26 per metric ton on an FOB basis. The USA, meanwhile, is sitting at USD 1,441.98 per metric ton CIF. That’s close to a USD 192 difference per ton, and for anyone buying in bulk, that number adds up fast. Phosphoric Acid Latest Prices October 2026 ProductRegionIncoterm BasisPriceLast UpdatedPhosphoric AcidChinaFOBUSD 1,250.26/MTOctober 2026Phosphoric AcidUSACIFUSD 1,441.98/MTOctober 2026 Price Source: Procurement Resource A quick note before anyone reads too much into the raw numbers. China’s figure is FOB, meaning it reflects the cost at the port of origin before freight and insurance get added. The US figure is CIF, which bundles in those shipping and insurance costs already. So part of that gap isn’t really a “China is cheaper” story. It’s partly just two different pricing baselines sitting side by side. Still, even accounting for that, there’s a real story underneath these two numbers. What’s Pushing China’s Price Down China remains one of the largest phosphate rock producers on the planet, and that matters more than people realize. When you control a big chunk of the raw material supply chain, you’re not as exposed to the price swings that hit import-reliant markets. Chinese producers also benefit from scale. Massive domestic fertilizer demand keeps plants running at higher utilization rates, which spreads fixed costs across more output and keeps per-unit pricing more competitive. There’s also the energy angle. Phosphoric acid production is energy-intensive, and China’s domestic energy pricing, especially for industrial users tied to long-term contracts, has stayed comparatively stable this year. That stability shows up directly in the FOB number. Why the USA Is Paying More The US picture looks almost like a mirror image. Domestic phosphate rock production has been shrinking for years, largely due to environmental permitting hurdles and the depletion of easily accessible reserves in states like Florida. That means a growing share of phosphoric acid supply, or the raw inputs needed to produce it domestically, has to come from somewhere else. Importing isn’t free. Freight costs, port handling, insurance premiums, all of it gets folded into that CIF figure. Add in the dollar’s strength against some exporting currencies this year, and landed costs climb even when the underlying commodity price hasn’t moved dramatically. Then there’s demand. US agriculture leans heavily on phosphate-based fertilizers, and with planting cycles and fertilizer restocking happening on fairly predictable seasonal timing, buyers often can’t wait out a price dip. That urgency gives sellers a bit more pricing power than they’d have in a market where buyers could simply delay purchases. What This Means If You’re Buying or Watching This Market For procurement teams sourcing phosphoric acid right now, the China-US spread isn’t just a curiosity. It’s a real input into sourcing strategy. Buyers with flexible logistics and the ability to manage longer lead times have an obvious incentive to look toward Chinese suppliers. Buyers who need faster turnaround, or who are tied to domestic supply chains for regulatory or contractual reasons, are going to keep absorbing that higher US cost. Investors and corporate advisers watching this space should pay attention to how long this gap holds. Price differentials this size don’t usually stay frozen. Either US domestic capacity gets a reason to expand, which seems unlikely in the near term given the permitting environment, or import volumes from lower-cost regions keep climbing, which would gradually narrow the spread as competition among suppliers increases. There’s also a ripple effect worth keeping in mind. Phosphoric acid feeds directly into fertilizer pricing, and fertilizer costs are one of the most closely watched line items in global agriculture. A sustained gap like this one could start showing up in regional fertilizer cost differences within a few quarters, particularly for crops where phosphate-based inputs make up a large share of total input cost. Frankly, nobody can say with full certainty where this settles by year end. But the structural reasons behind the gap, raw material access in China versus import dependency in the US, aren’t the kind of thing that flips in a month. For now, the spread looks less like noise and more like a reflection of where each market actually stands. For deeper cost breakdowns and production economics behind these numbers, Procurement Resource’s Phosphoric Acid Production Cost Report is worth a look.
Read Full Blog
kuni****@gmail.com 18 Nov 2026 25 Views